Every
vital sign,
on one
board.
A green check only means the server answered. It says nothing about a hero that shifted forty pixels, a certificate with nine days left, or a page that suddenly takes four seconds to load. Up isn't the same as working — DeadWatch watches the whole health picture, and turns on only what each site needs. Here's what it covers.
Each monitor optional per site · runs on the site's own interval · no agent to install
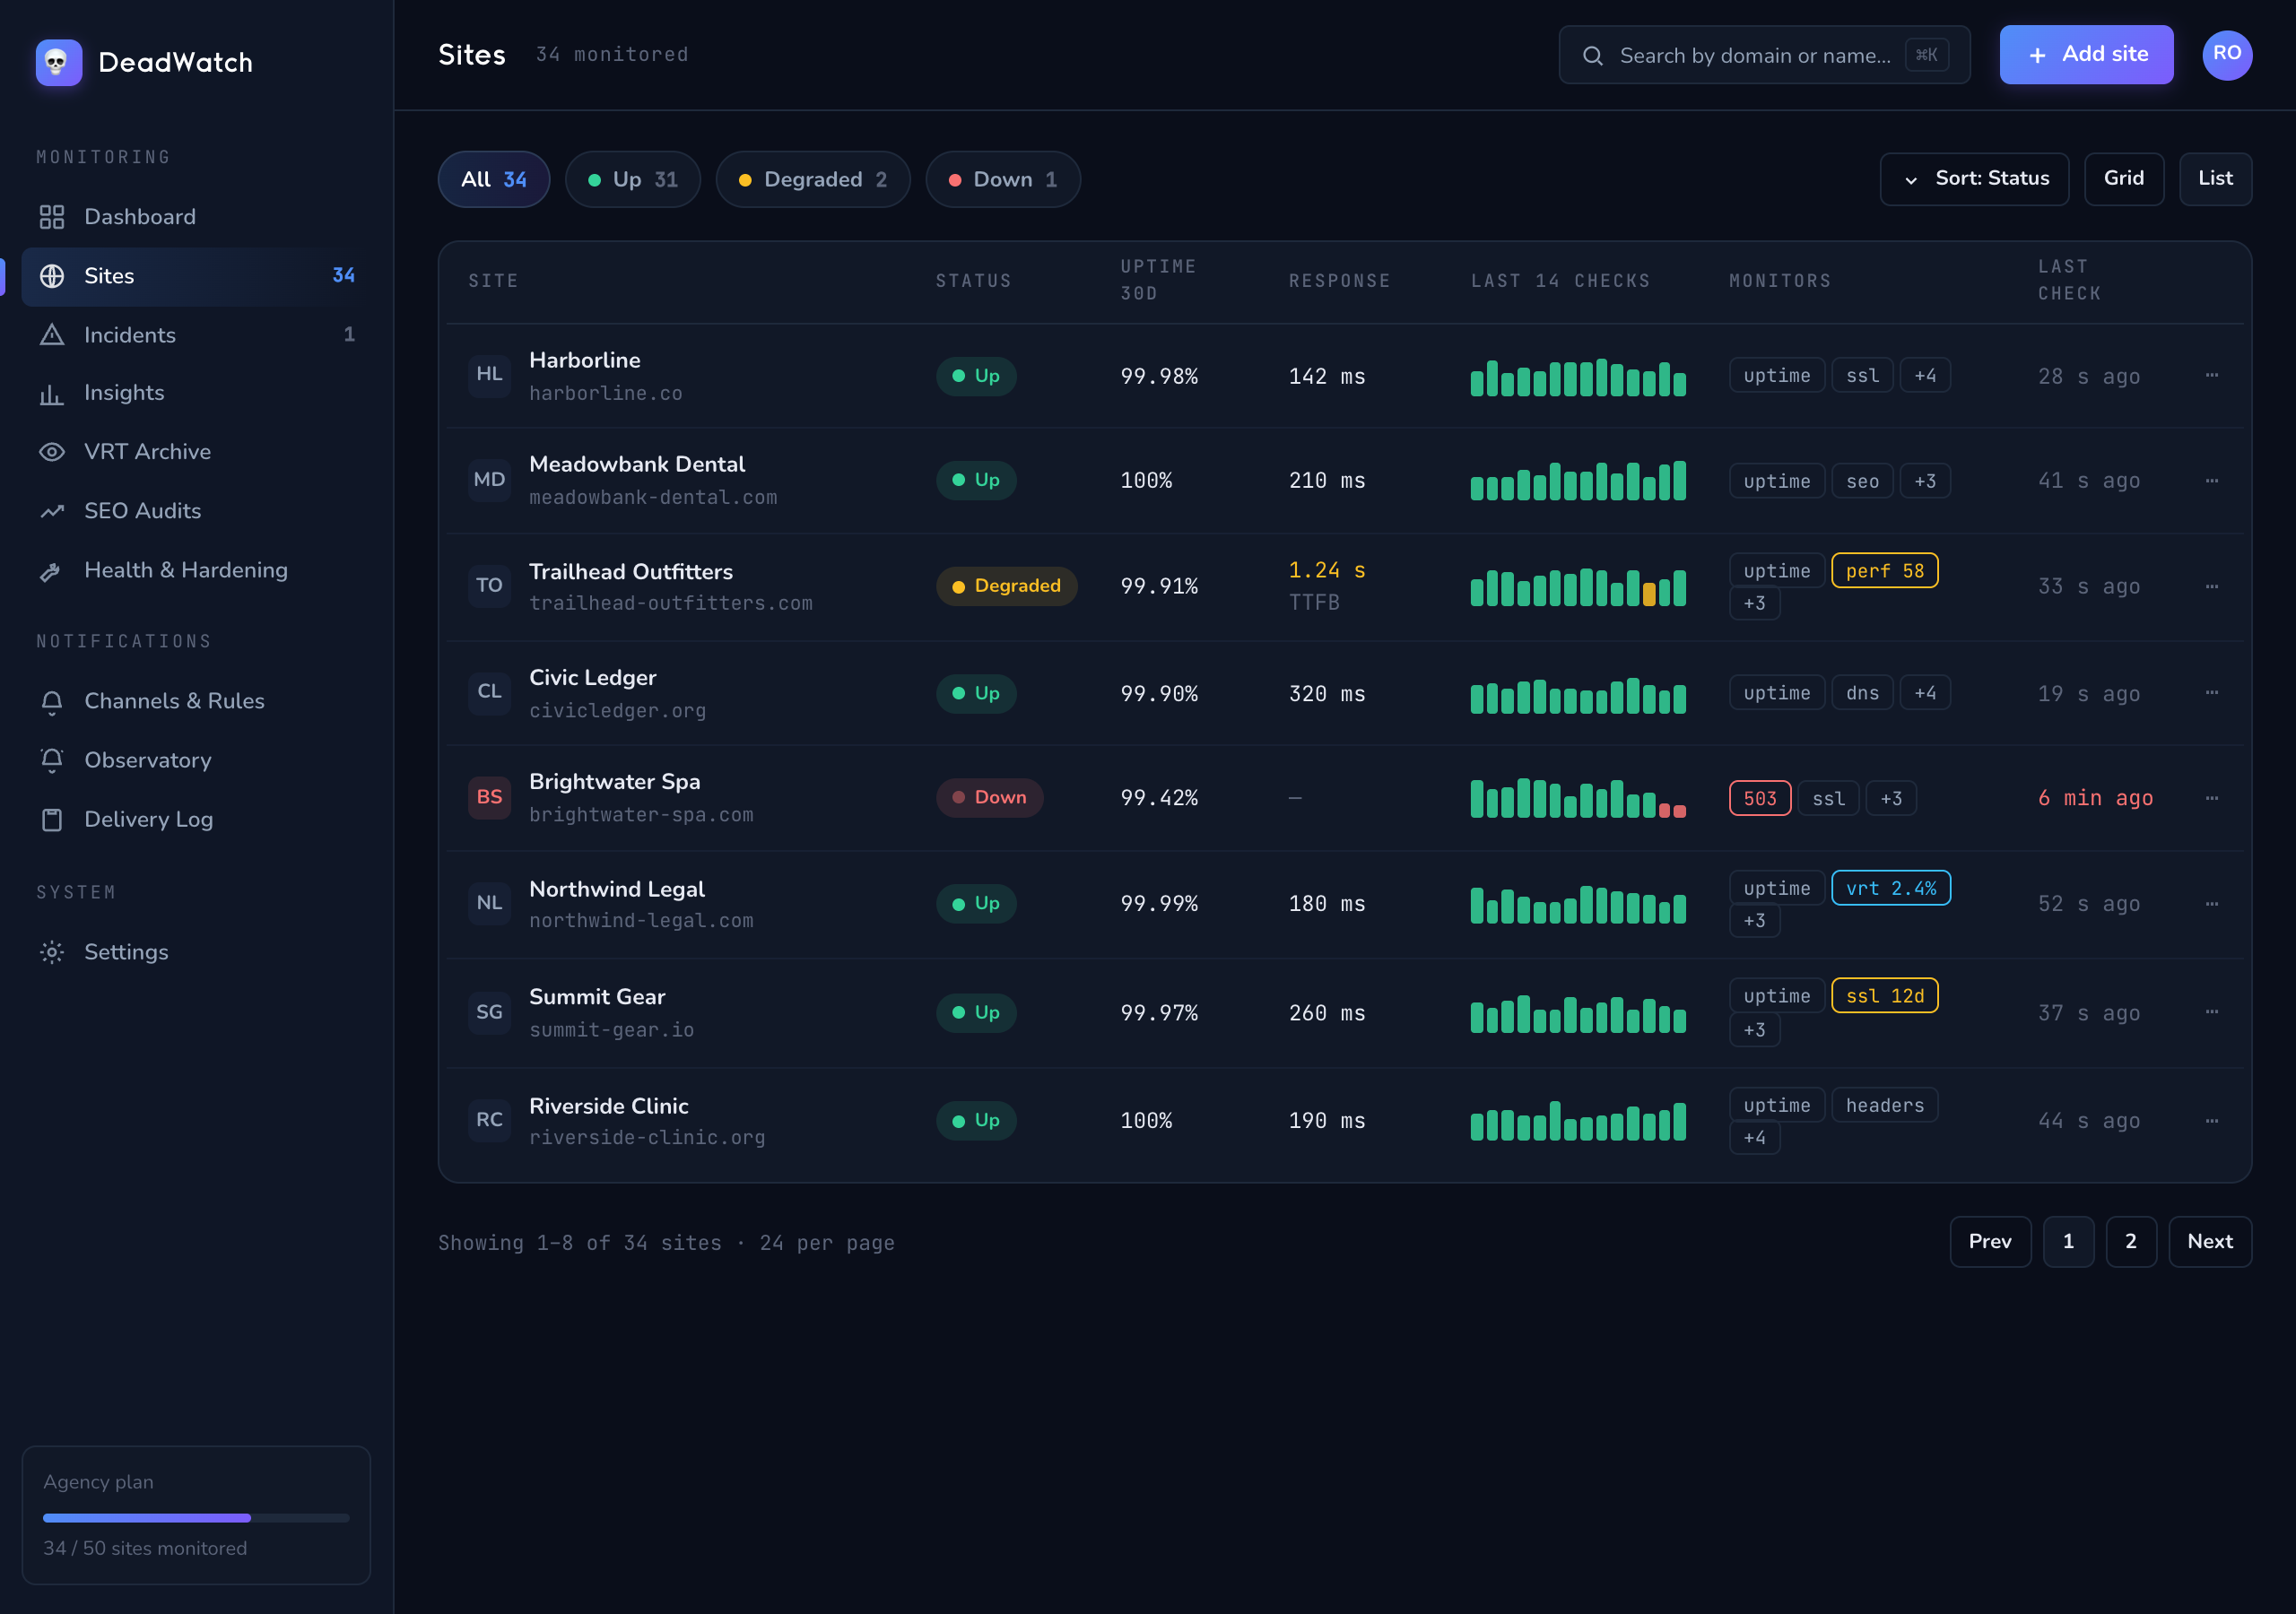
A real outage pages you. A blip doesn't.
Every check records a response time, an HTTP code and a classified reason code — curl_timeout, http_503, success_slow — so the why is legible. A single failure never pages you: DeadWatch re-checks before opening an incident.
- ✓A confirmation re-check before an incident opens; a 5xx is trusted immediately
- ✓Flapping guard — 3+ state changes in 10 minutes suppresses the pager storm and surfaces one signal
- ✓Incidents run open → acknowledged → resolved, with the resolution reason recorded
- ✓Maintenance windows hold alerts during planned deploys; checks still run
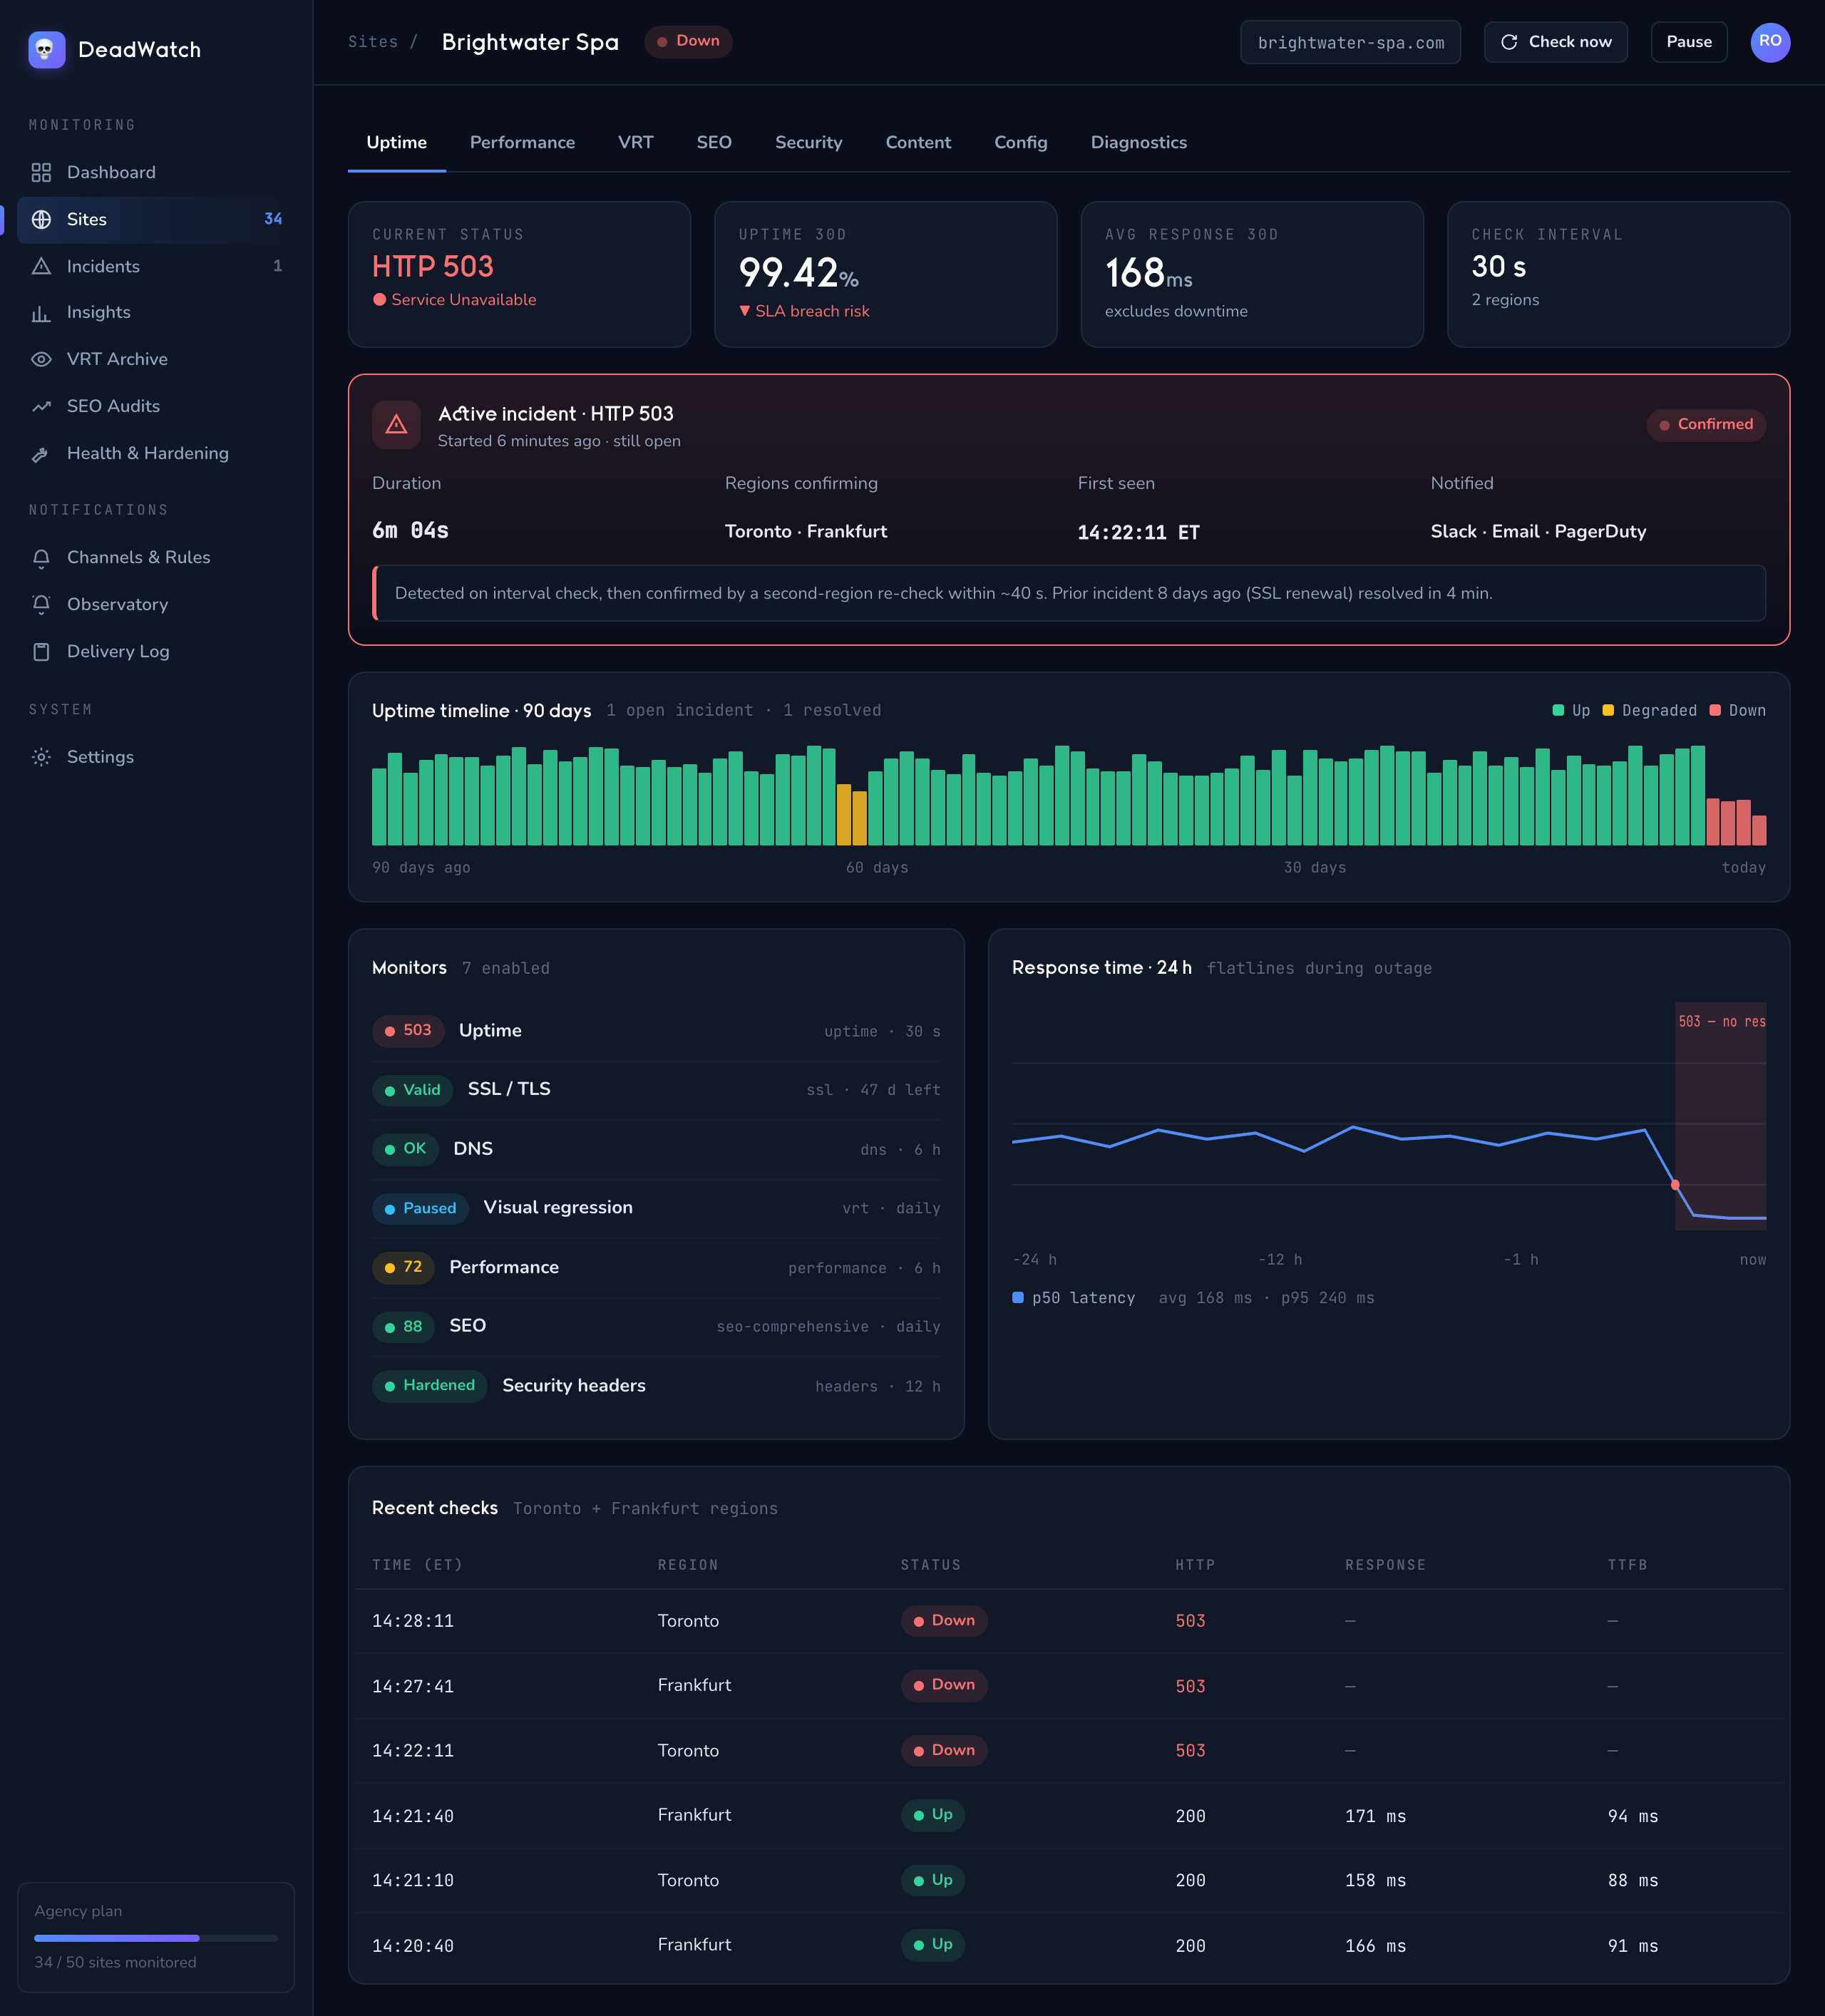
See exactly what changed, pixel for pixel.
DeadWatch screenshots each monitored URL and compares it against an approved baseline, reporting diff_percent per breakpoint. A change that only breaks on mobile is still caught, and an anomalous jump stands out against the page's own rolling history.
- ✓Baseline / latest / diff overlay for each capture
- ✓Weighted zones — weight the header or hero heavier than a noisy sidebar, so meaningful shifts flag and churn doesn't
- ✓Runs across mobile, tablet and desktop presets; aggregates to the worst one
- ✓Approve a legitimate redesign as the new baseline so it stops flagging
- ✓Records capture mode, color scheme, viewport preset and URL path
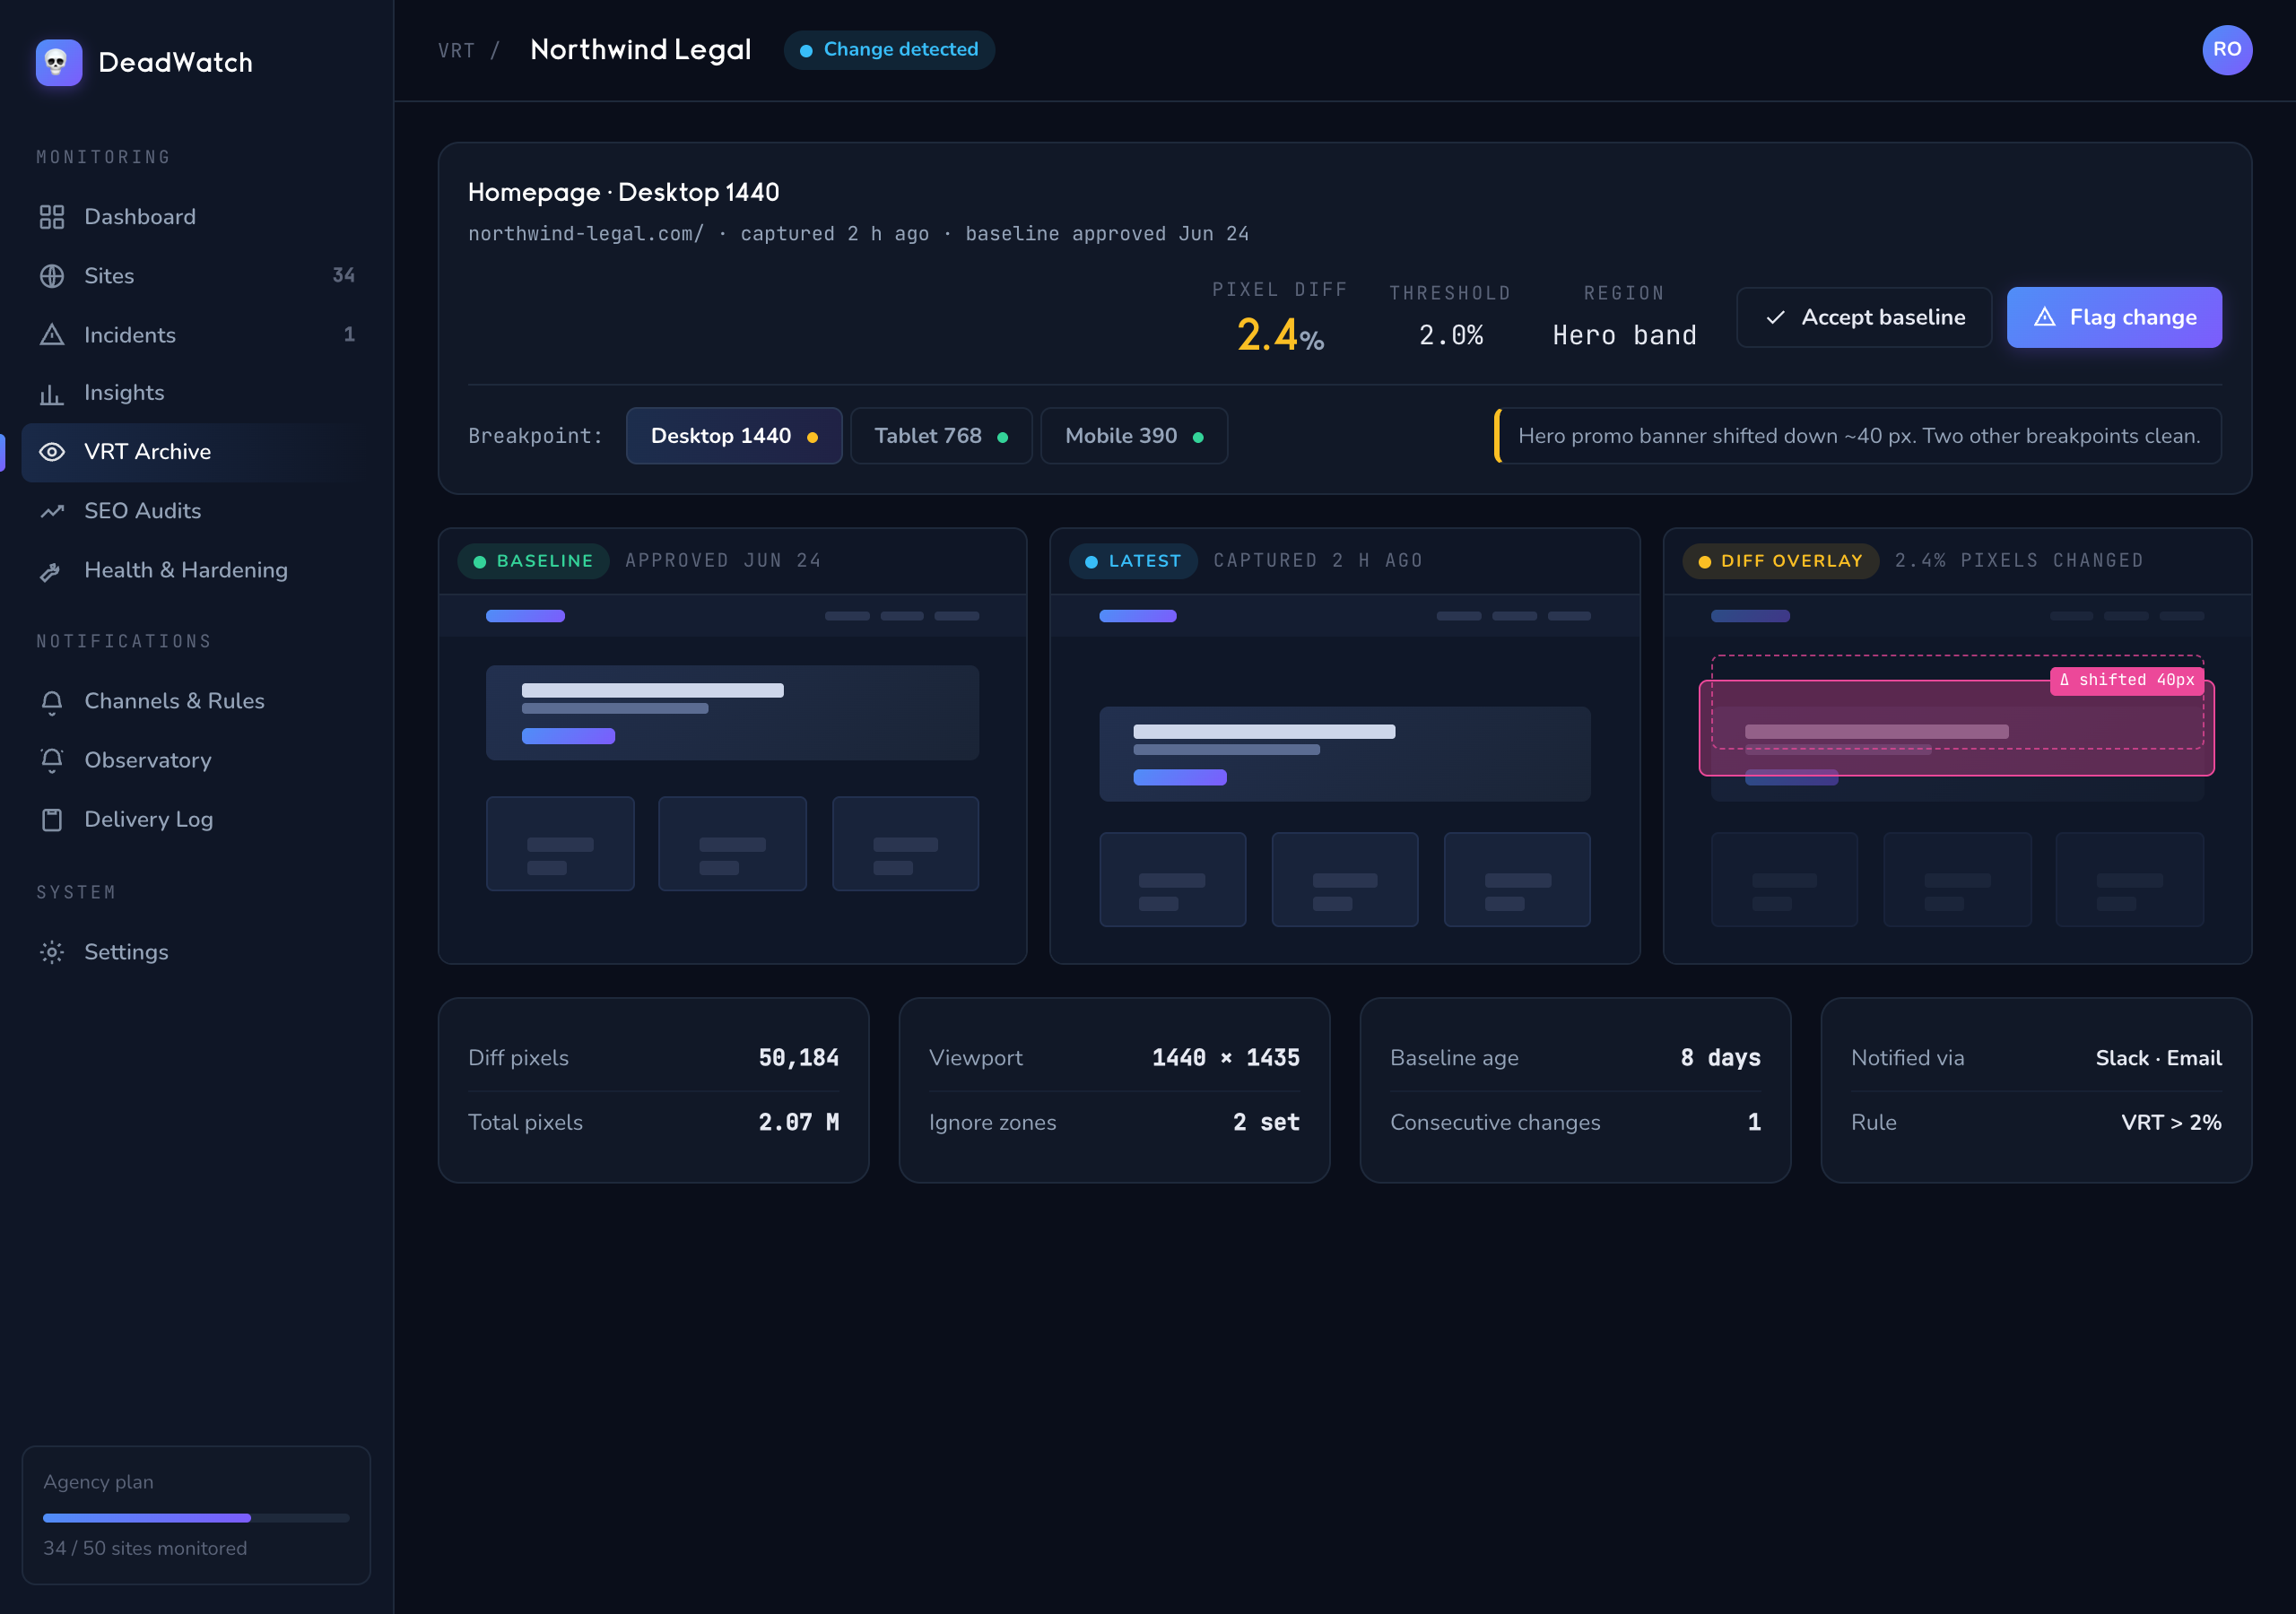
The speed regression, caught before it costs rankings.
Measured in a real headless browser: LCP, FCP, CLS, TBT, TTFB and INP, plus TTI, Speed Index and page weight. DeadWatch computes a 0–100 score with Lighthouse-style log-normal scoring, weighted toward the metrics users feel most, and maps it to an A–F grade.
- ✓Per-metric bands — Excellent / Good / Needs Improvement / Poor
- ✓Real-user CrUX field data surfaced alongside the lab numbers where available
- ✓Missing metrics renormalize the weights so the score stays fair
- ✓Trend history so you can tell a one-off from a slide (58/D, down from 74)
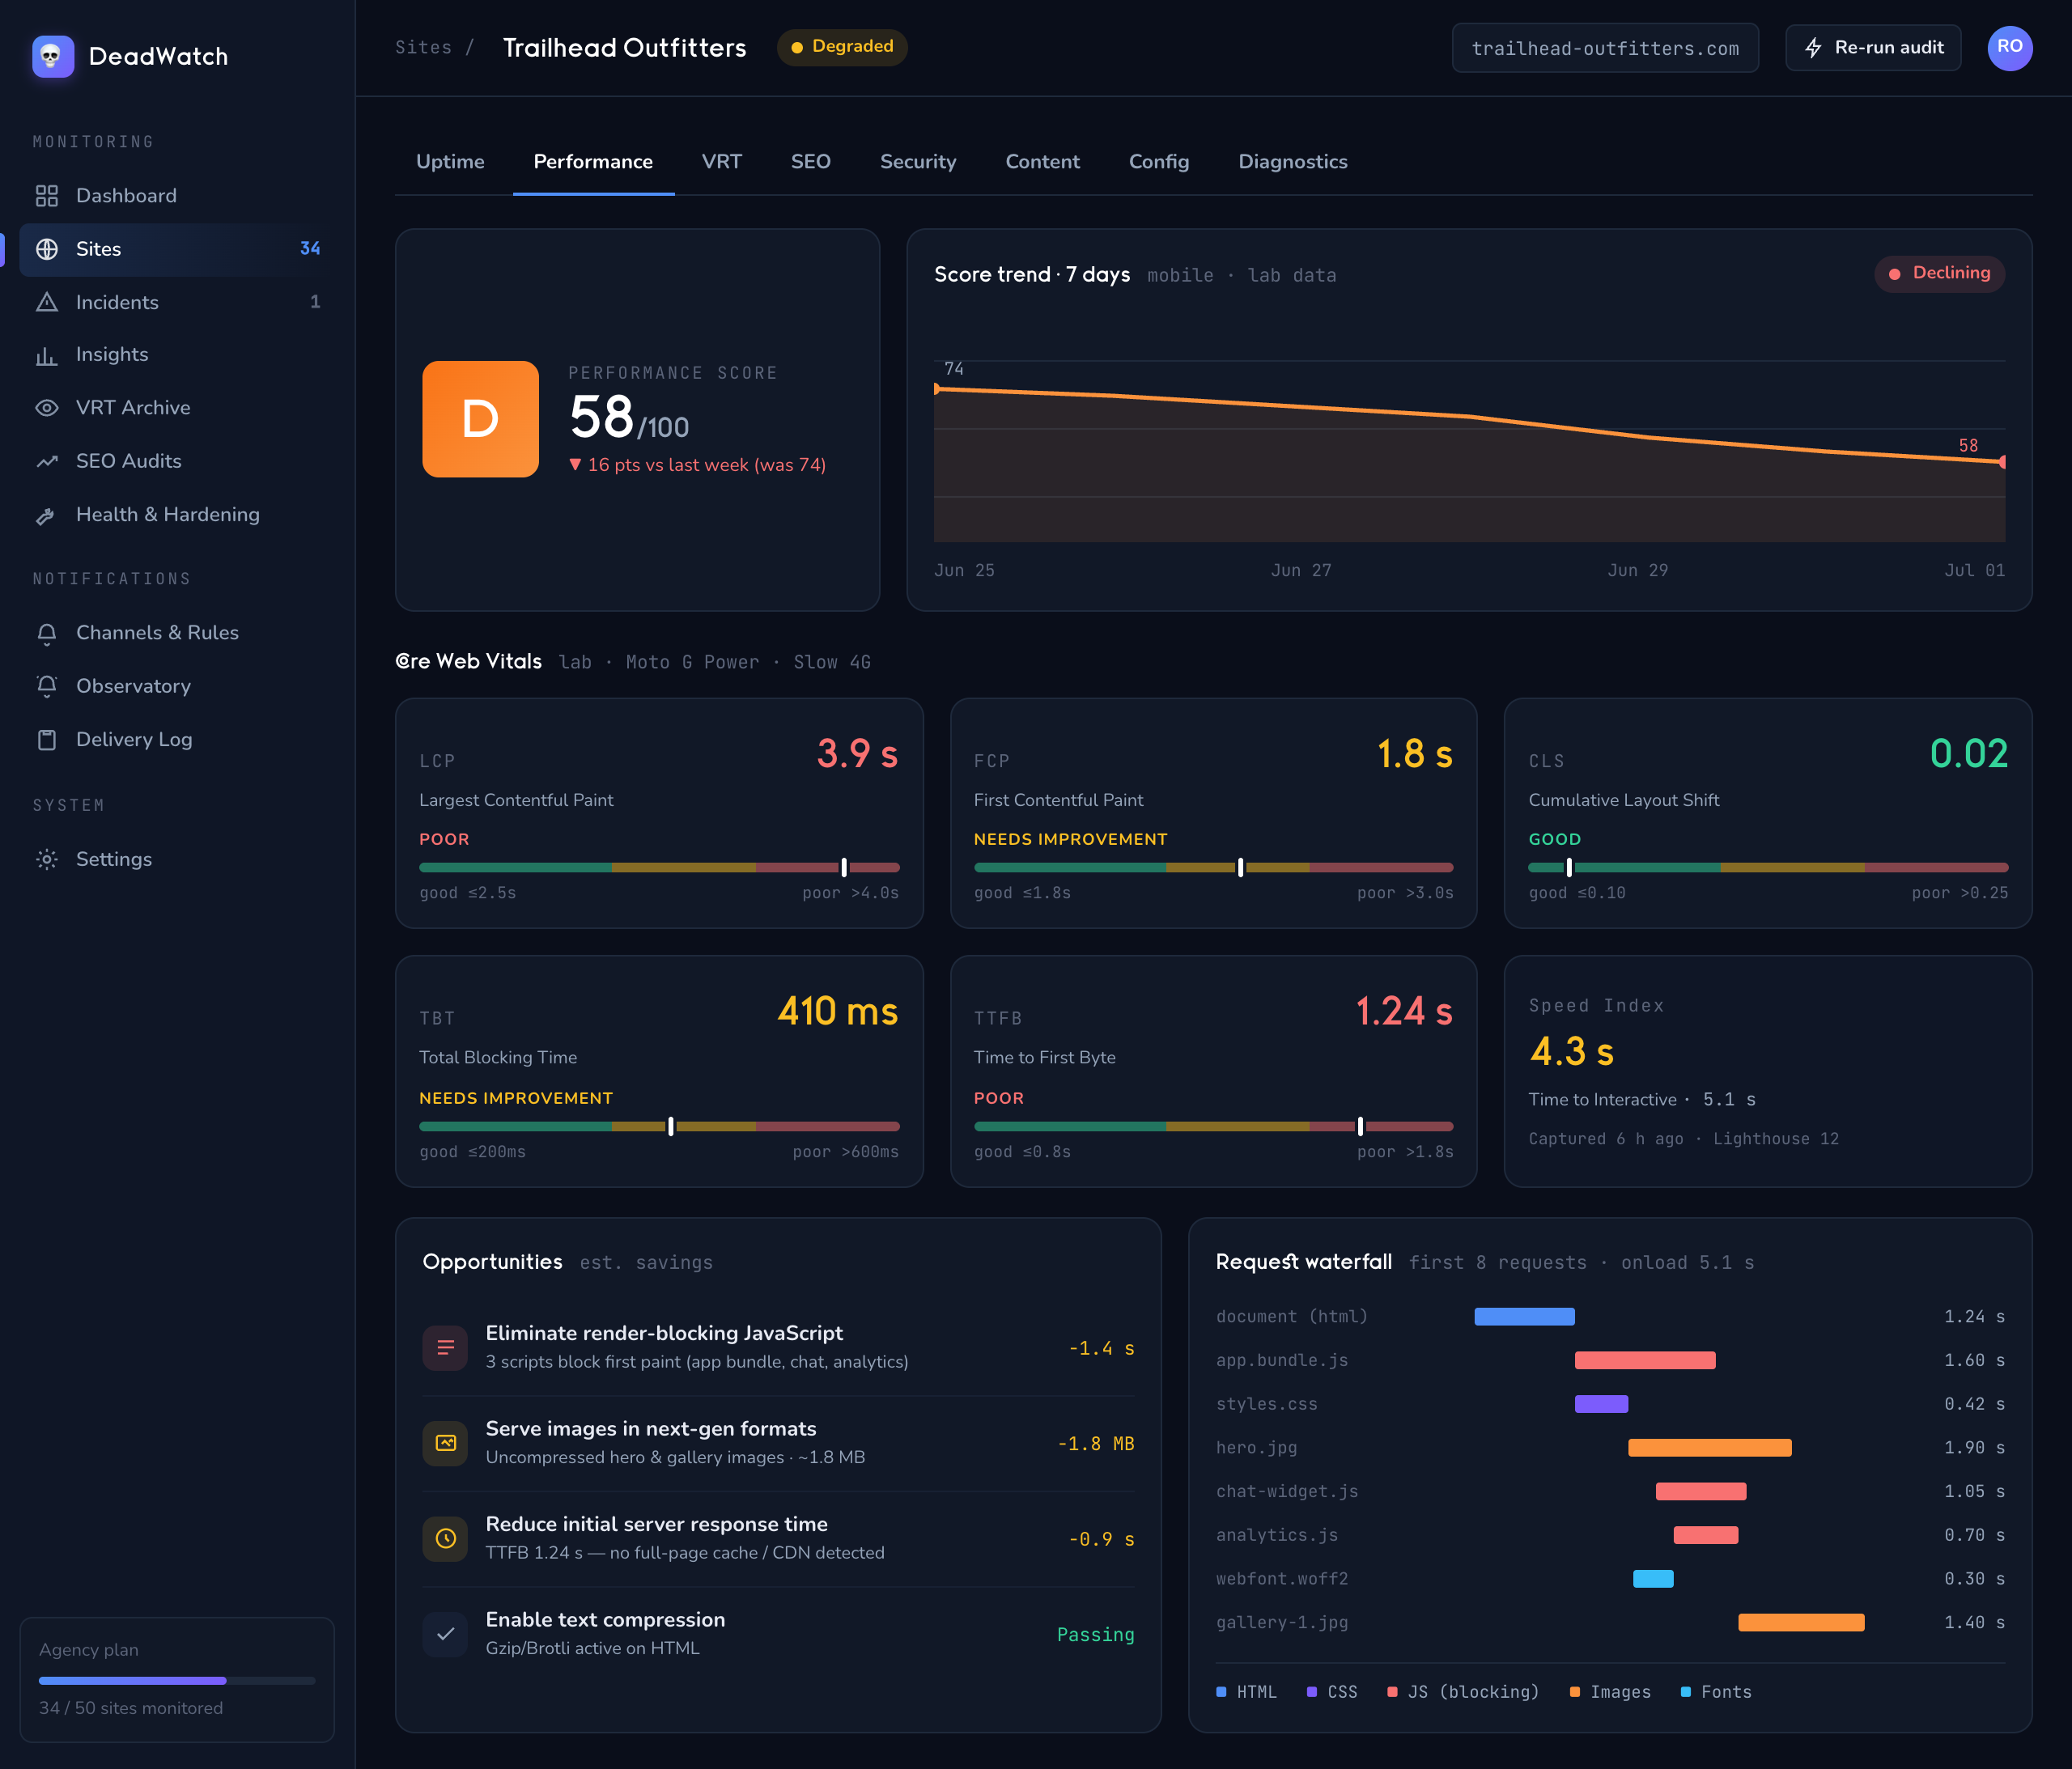
The silent failures, flagged weeks ahead.
A certificate about to lapse, an MX record that vanished, a domain nobody renewed — none of these throw an error page. They just take the site down when nobody's looking. DeadWatch tracks all three and warns you with real lead time.
- ✓SSL/TLS — days until expiry, issuer, validity; warns within 30 days, critical when expired
- ✓DNS — A, AAAA, MX, TXT, NS, CNAME, SOA; a moved nameserver is often the first sign of trouble
- ✓WHOIS/RDAP domain expiry — registrar, expiry date and status, lead time in weeks
- ✓SEO drift — robots, sitemap and canonical changes that erode rankings without erroring
Header hardening, scored and watched.
DeadWatch reads the hardening posture expressed in each site's response headers and folds a security_score into the health picture as the Security pillar. It's the monitoring-side security signal — whether the right protections are actually set.
- ✓CSP · HSTS (max-age, includeSubDomains, preload) · X-Frame-Options
- ✓X-Content-Type-Options · Referrer-Policy · Permissions-Policy
- ✓States roll up ok / warning / critical into a hardening grade per site
- ✓Deeper adversarial probing — file exposure, soft-404 control — lives in the Kestrel diagnostic
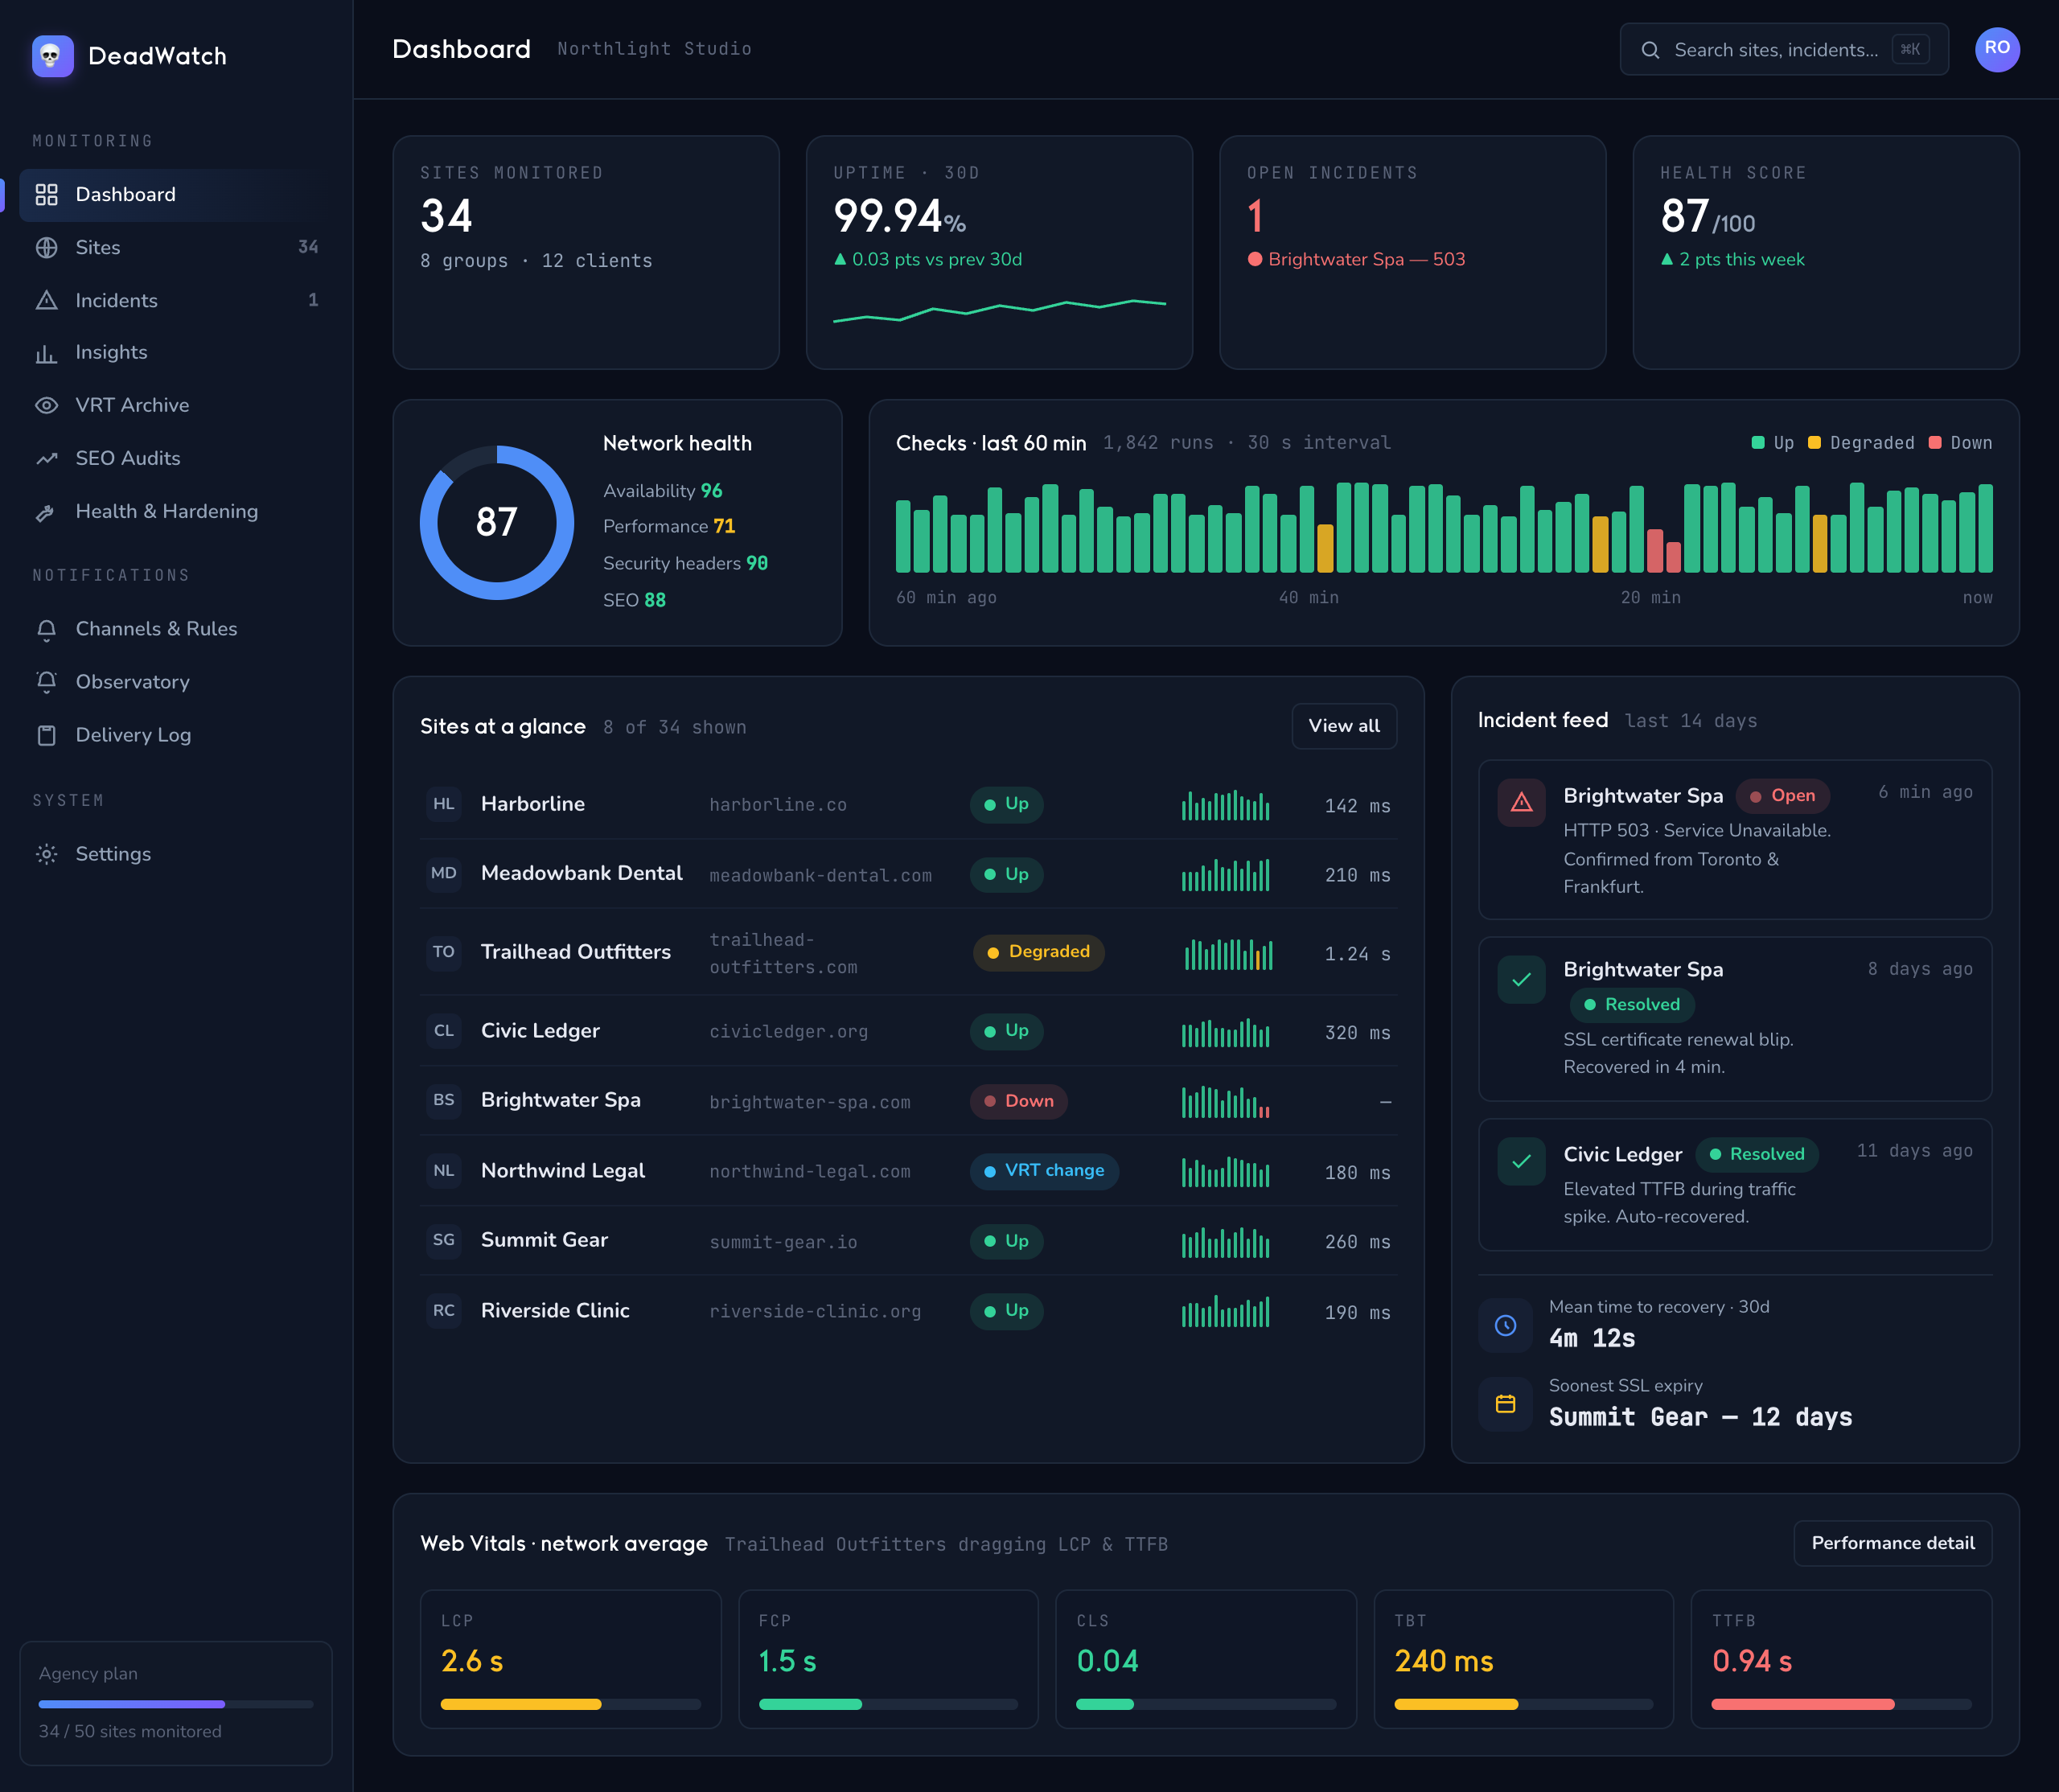
The alert reaches you first — and only when it matters.
You decide what's worth interrupting your day for, and where it lands. Point each kind of alert at the channel your team actually watches — and if Slack happens to be down the second it fires, the alert still gets through. Nothing quietly dropped.
- ✓Email, Slack, Discord and generic webhook — Slack & Discord auto-detected from the URL
- ✓Route different sites or clients to different channels
- ✓Rules for down-after-confirm, perf drop > 15 pts, VRT change > 2%, SSL expiry < 14 days
- ✓Flapping guard and maintenance windows keep the noise down
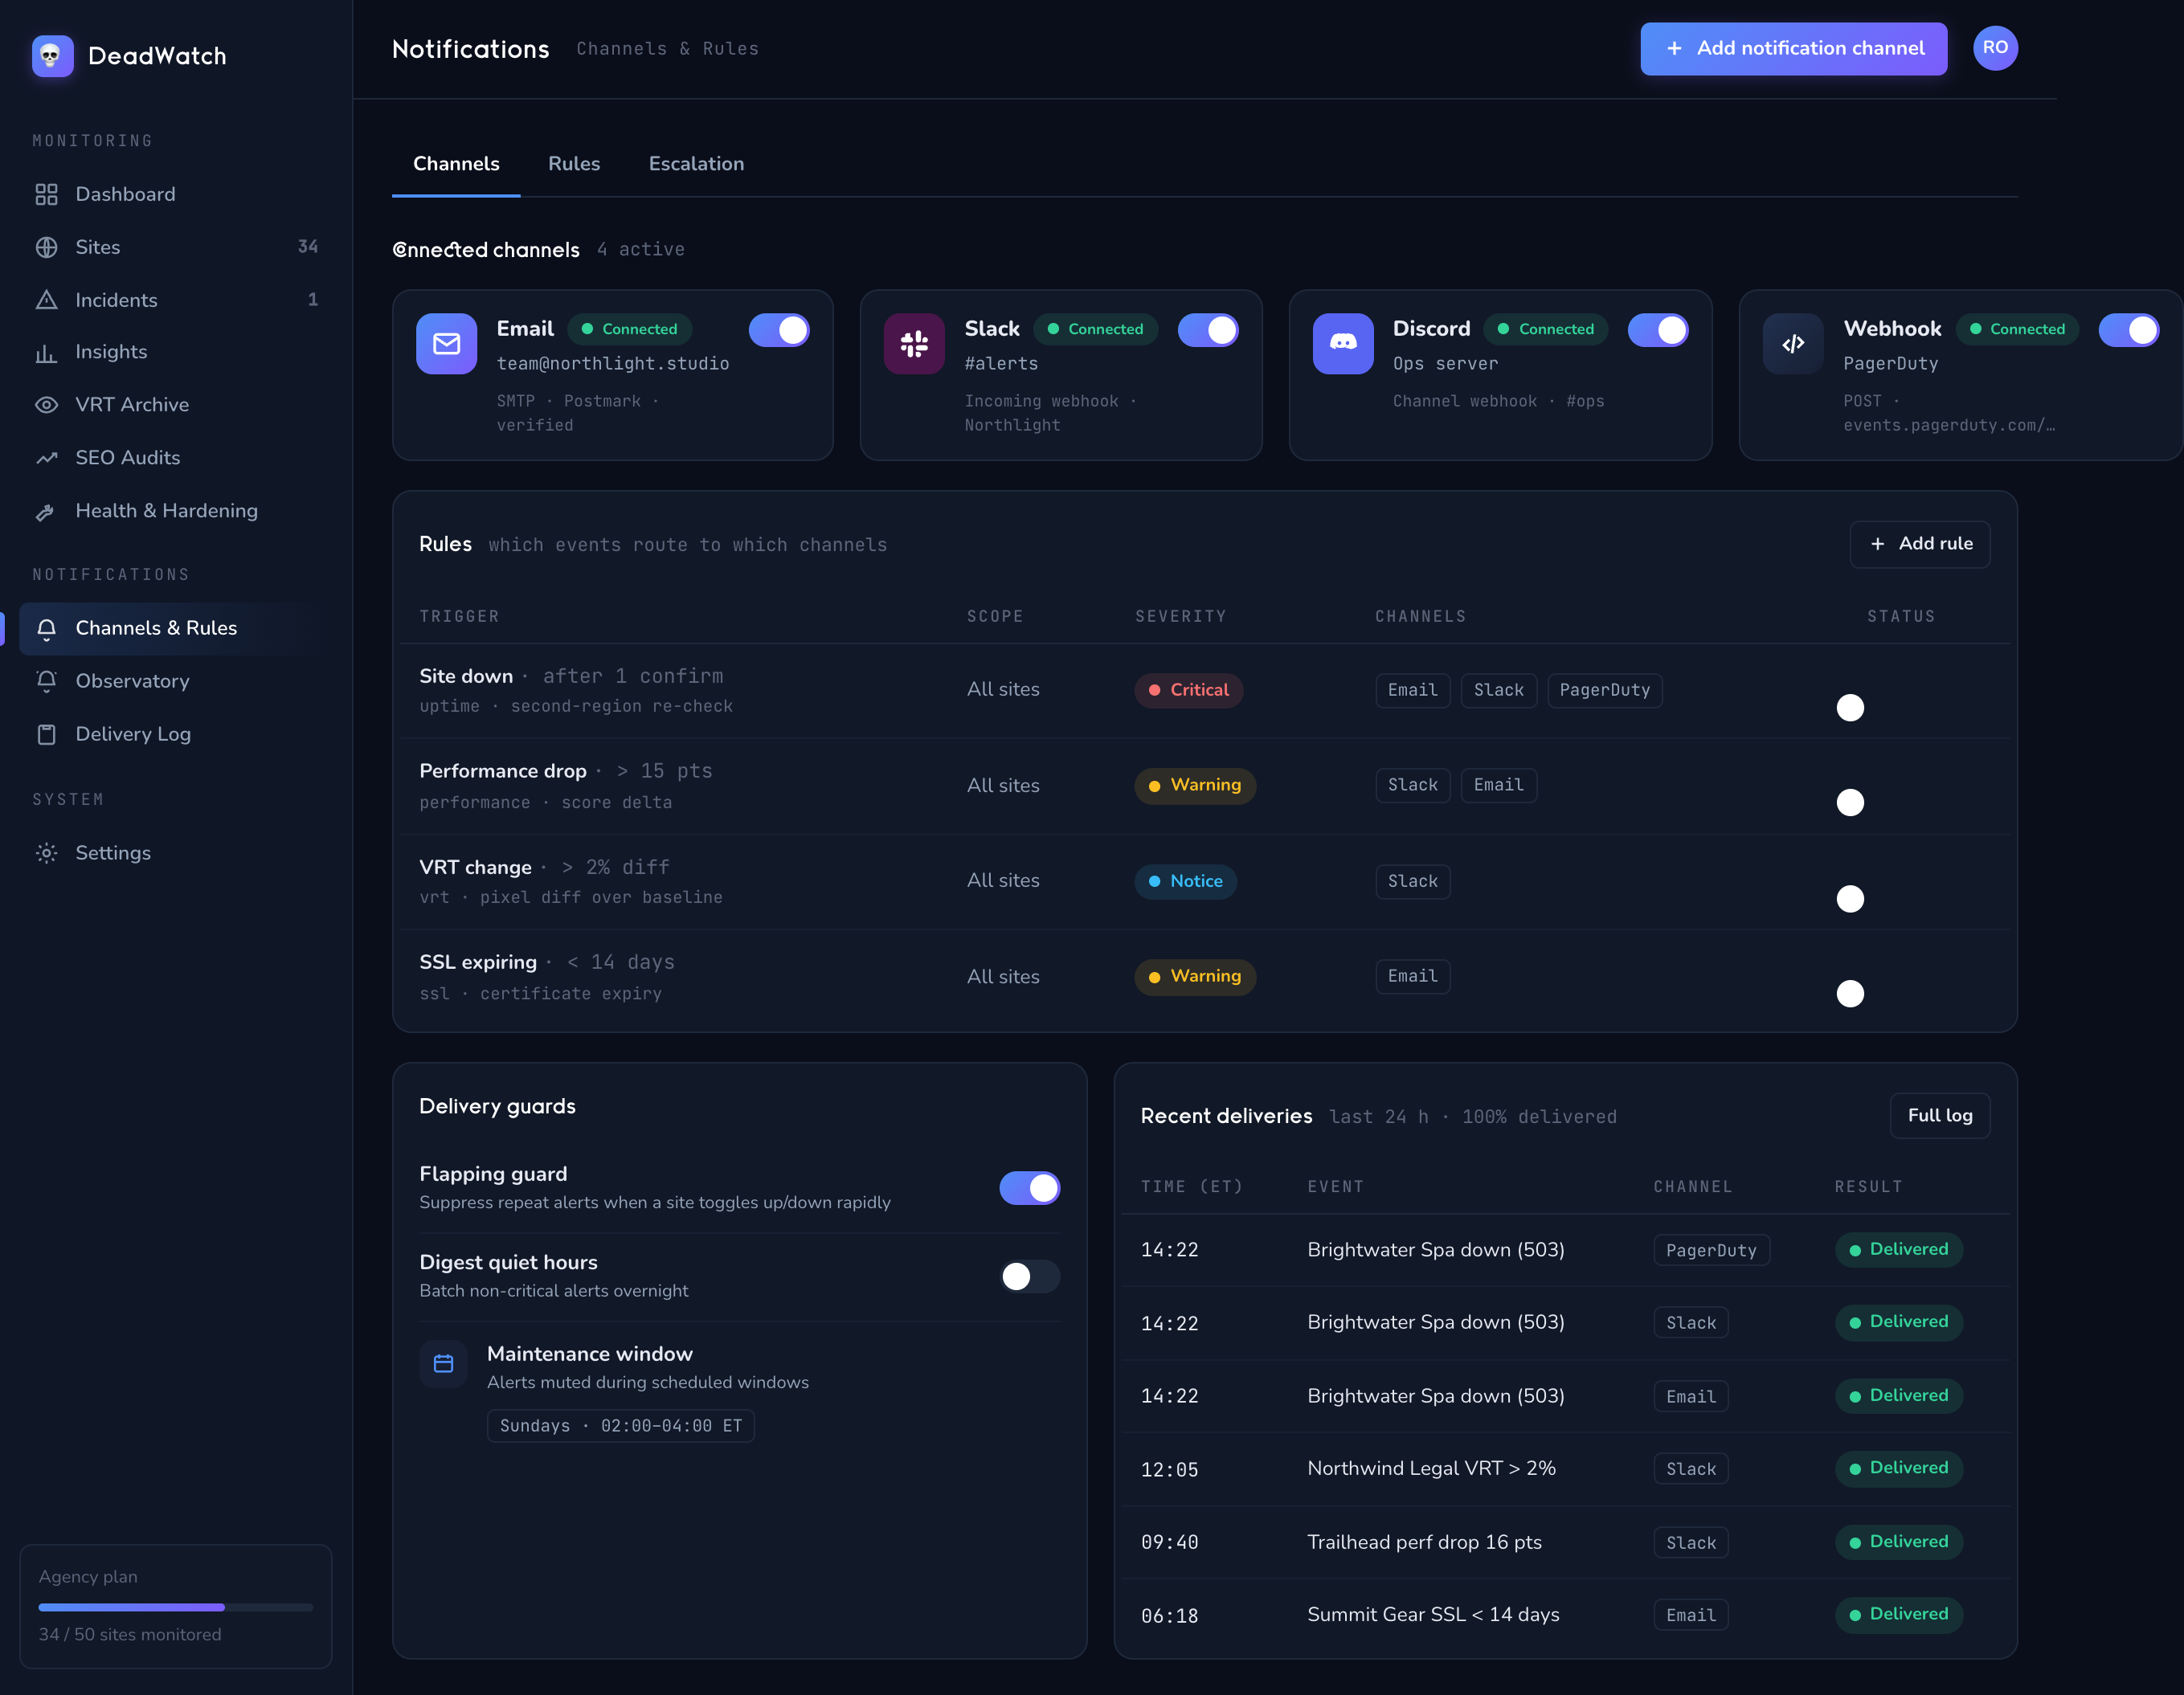
The right people see the right sites.
Your team sees the sites they work on. Your clients, if you invite them, see only their own — their uptime and their health, never your full roster and never each other.
Roles that fit how you work
From full admin down to read-only, plus tokens for anything you wire up yourself. Give each person exactly what they need to do their job — and nothing past it.
A view that's just theirs
Invite a client and they land on their sites alone — status, incidents, the health you're keeping. Your other work stays out of sight, and their alerts can go to their own Slack.
You choose what they see
Show a client everything on their sites, or trim it to the essentials. The same site can read one way to your team and a simpler way to the person paying for it.
Every other signal, on the same board.
Beyond the headline monitors, DeadWatch keeps an eye on the quieter signals — the network, integrity and search things that decide whether a site stays healthy long after launch. Every one is live today; switch on the ones a site needs and leave the rest.
DNS & DNS audit
A, AAAA, MX, TXT, NS, CNAME and SOA records tracked, with an audit that flags a moved nameserver or a vanished mail record — often the first sign of trouble.
WHOIS / domain expiry
Registrar, expiry date and status via WHOIS/RDAP, with weeks of lead time before a domain nobody renewed silently drops the site.
Ports & ping
TCP port reachability and ICMP-style ping checks for latency and liveness, so a service that stops listening is caught at the network layer.
Content drift
Hash-based change tracking with a stability score — know when a page's content shifted, intentionally or not, without watching it by hand.
Link checking
Crawls the links on a site and tracks broken, redirected and healthy targets over time, so dead links surface before a visitor hits one.
Asset change tracking
Fingerprints JS and CSS assets and flags new, removed or changed files — a fast read on what a deploy actually shipped, or what a third party slipped in.
SEO & search integrity
Robots.txt, sitemap and canonical tracking, plus keyword-rank position monitoring — the ranking signals that erode without ever throwing an error.
Hijacking & cloaking
Detection for redirect hijacking, cloaking, spam injection and hidden links — a compromise caught before it wrecks reputation or search standing.
Cron health & www-parity
Scheduled-job liveness so a silently-dead cron gets noticed, and apex-vs-www parity so the two versions of a site don't drift apart.
Everything you need to actually run it.
No sales call to get going
Pick a plan, pay with a card, and you're watching sites the same afternoon. Change plans, add packs, and pull your own invoices — without booking a demo or waiting on anyone.
Your instance, your data
You're not a row in someone's shared database. Each agency gets its own instance at its own subdomain, with its own data — run by us, or on your own servers if that's a line you can't cross.
A real person when it counts
When something's off, you open a ticket and reach someone who knows the product — not a forum thread and a week of silence.
Bring your sites.
See what it catches.
Get set up in minutes. See how the workflow fits together, or read the monitoring reference for the full detail.